Quiz score consistency
Use sample standard deviation to see how tightly a class's quiz scores cluster around the average.
Data: 72, 75, 78, 80, 85
Mean = 78, sample SD ≈ 5.05
Our free standard deviation calculator computes the standard deviation, variance, mean and other statistical measures from your data. Simply input your values, choose between population or sample calculation, and get accurate results instantly.
Enter your data and select calculation type to find the standard deviation and other statistical measures.
Separate values with spaces, commas, semicolons, or line breaks
Sample (n-1) is commonly used when your data is a subset of a larger population
Enter data and calculate to see results
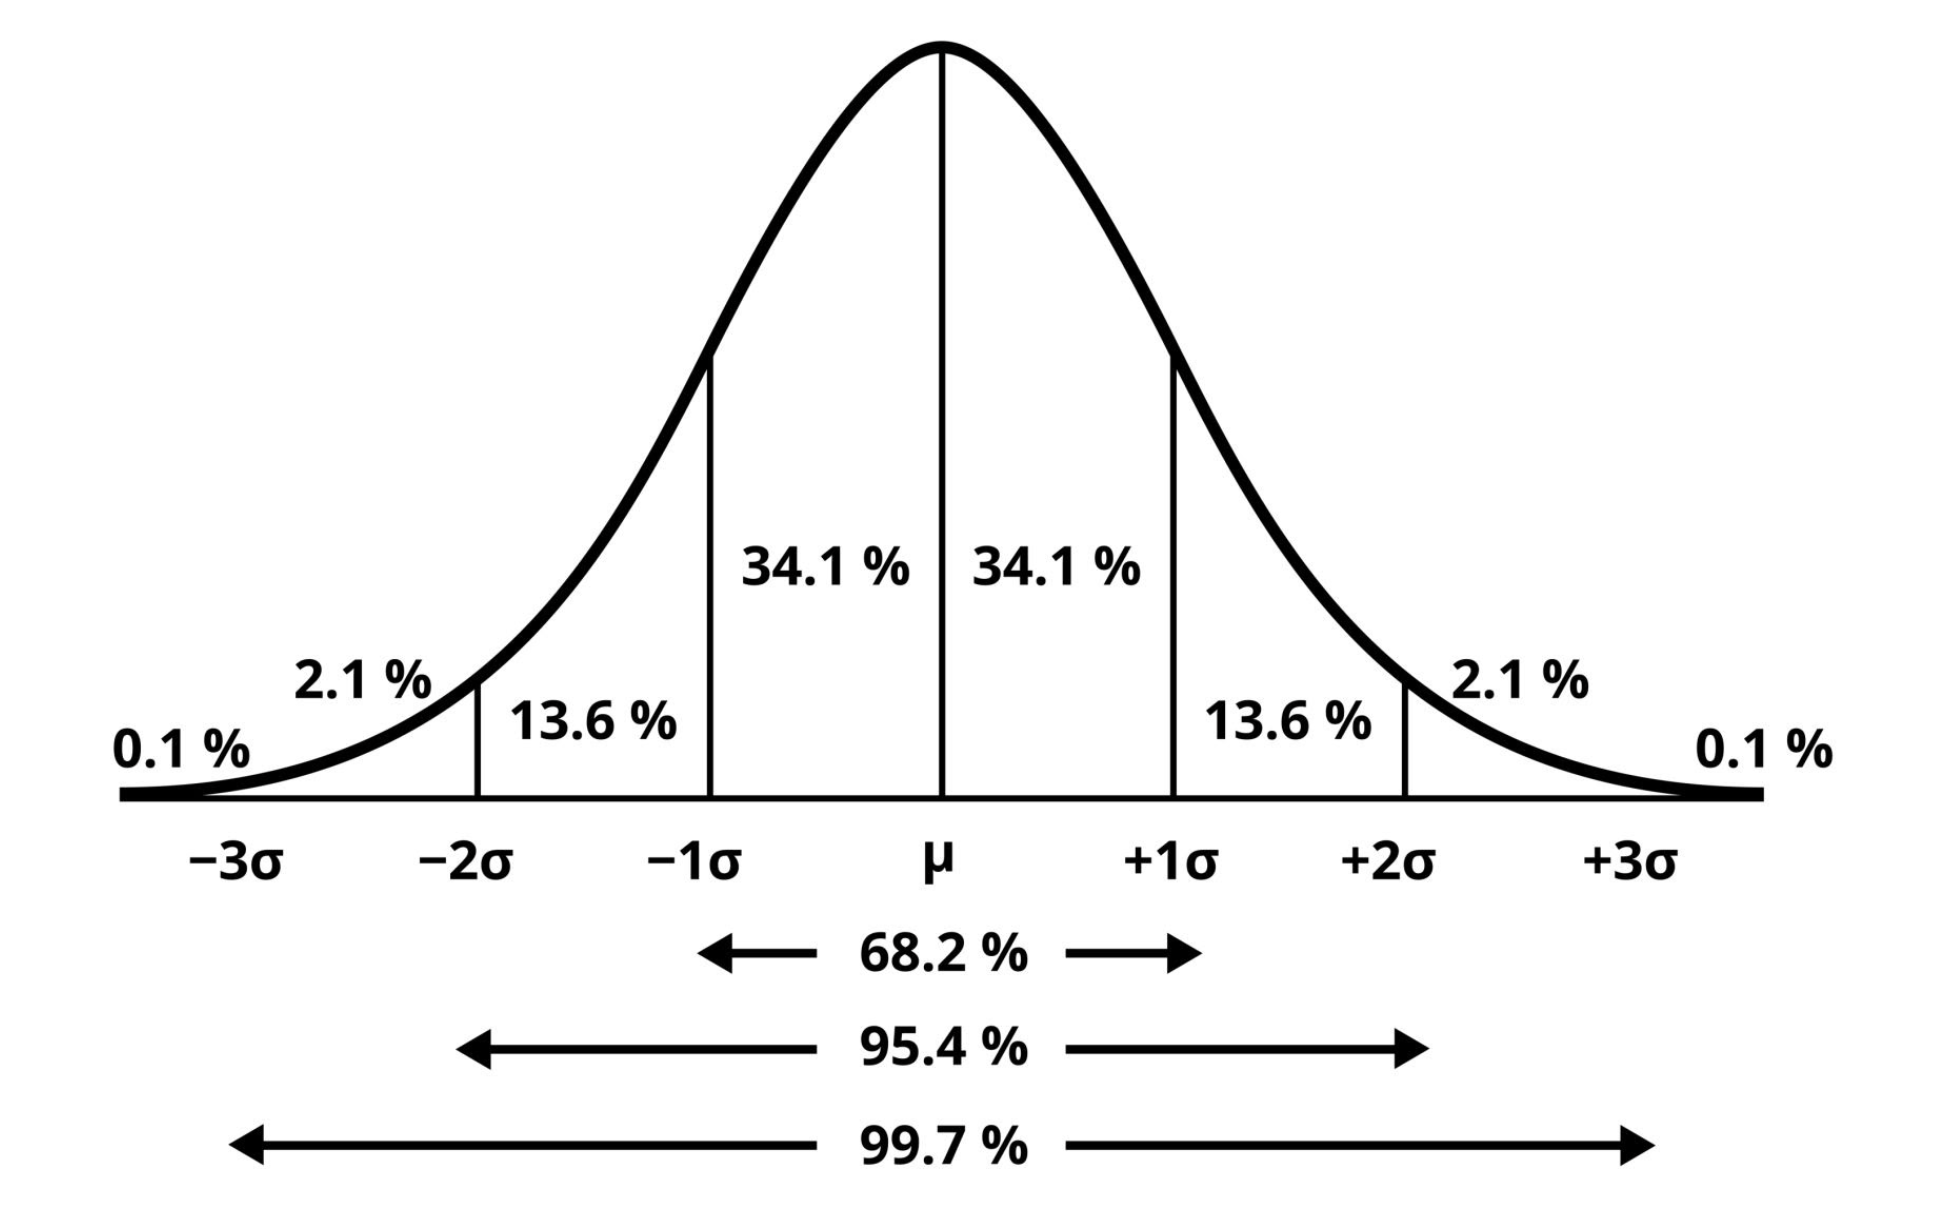
Standard deviation is a statistical measure that quantifies the amount of variation or dispersion in a set of values. A low standard deviation indicates that the values tend to be close to the mean, while a high standard deviation indicates that the values are spread out over a wider range. Standard deviation is represented by the Greek letter σ (sigma) for a population and the letter s for a sample.
There are two main formulas for standard deviation, depending on whether you're calculating it for an entire population or a sample:
| Type | Formula | Description |
|---|---|---|
| Population SD (σ) | \( \sigma = \sqrt{\frac{\sum(x_i - \mu)^2}{N}} \) | Used when data represents the entire population |
| Sample SD (s) | \( s = \sqrt{\frac{\sum(x_i - \bar{x})^2}{n-1}} \) | Used when data is a sample from a larger population |
Calculate the mean (average) of all values
Find the deviation of each value from the mean
Square each deviation
Calculate the variance (average of squared deviations)
Take the square root of the variance to get the standard deviation
Use sample standard deviation when your values come from a subset of a larger group. Use population standard deviation only when the list includes every value in the group you are studying.
Standard deviation is widely used in various fields to understand variability and make informed decisions:
Use sample standard deviation to see how tightly a class's quiz scores cluster around the average.
Data: 72, 75, 78, 80, 85
Mean = 78, sample SD ≈ 5.05
Use population standard deviation when you have every monthly order total for a fixed period.
Data: 120, 135, 128, 140, 132, 145
Mean ≈ 133.33, population SD ≈ 8.18
A low SD means measured parts stay close to the target dimension.
Data: 10.01, 9.99, 10.02, 10.00, 9.98
Sample SD is small, so the process is stable
Compare the spread of several monthly returns before evaluating overall risk.
Data: 2.4, -1.1, 3.0, 1.8, -0.6
Higher SD indicates more volatile returns
Use sample standard deviation when your dataset is only part of a larger population. It divides by n-1 to reduce bias when estimating the population spread.
A higher standard deviation means the values are more spread out from the mean. A lower value means the dataset is more tightly clustered.
No. Standard deviation is the square root of variance, so the result is always zero or positive.
Variance and mean help you interpret standard deviation. The mean shows the center of the data, and variance shows the squared spread before taking the square root.